
Want to get a better understanding of all the leads your Exit Bee campaign has generated?
Select ‘Leads’ from the left sub-menu on your analytics dashboard.
You can edit the date range for which you want to view more insights on your leads from the top right calendar.
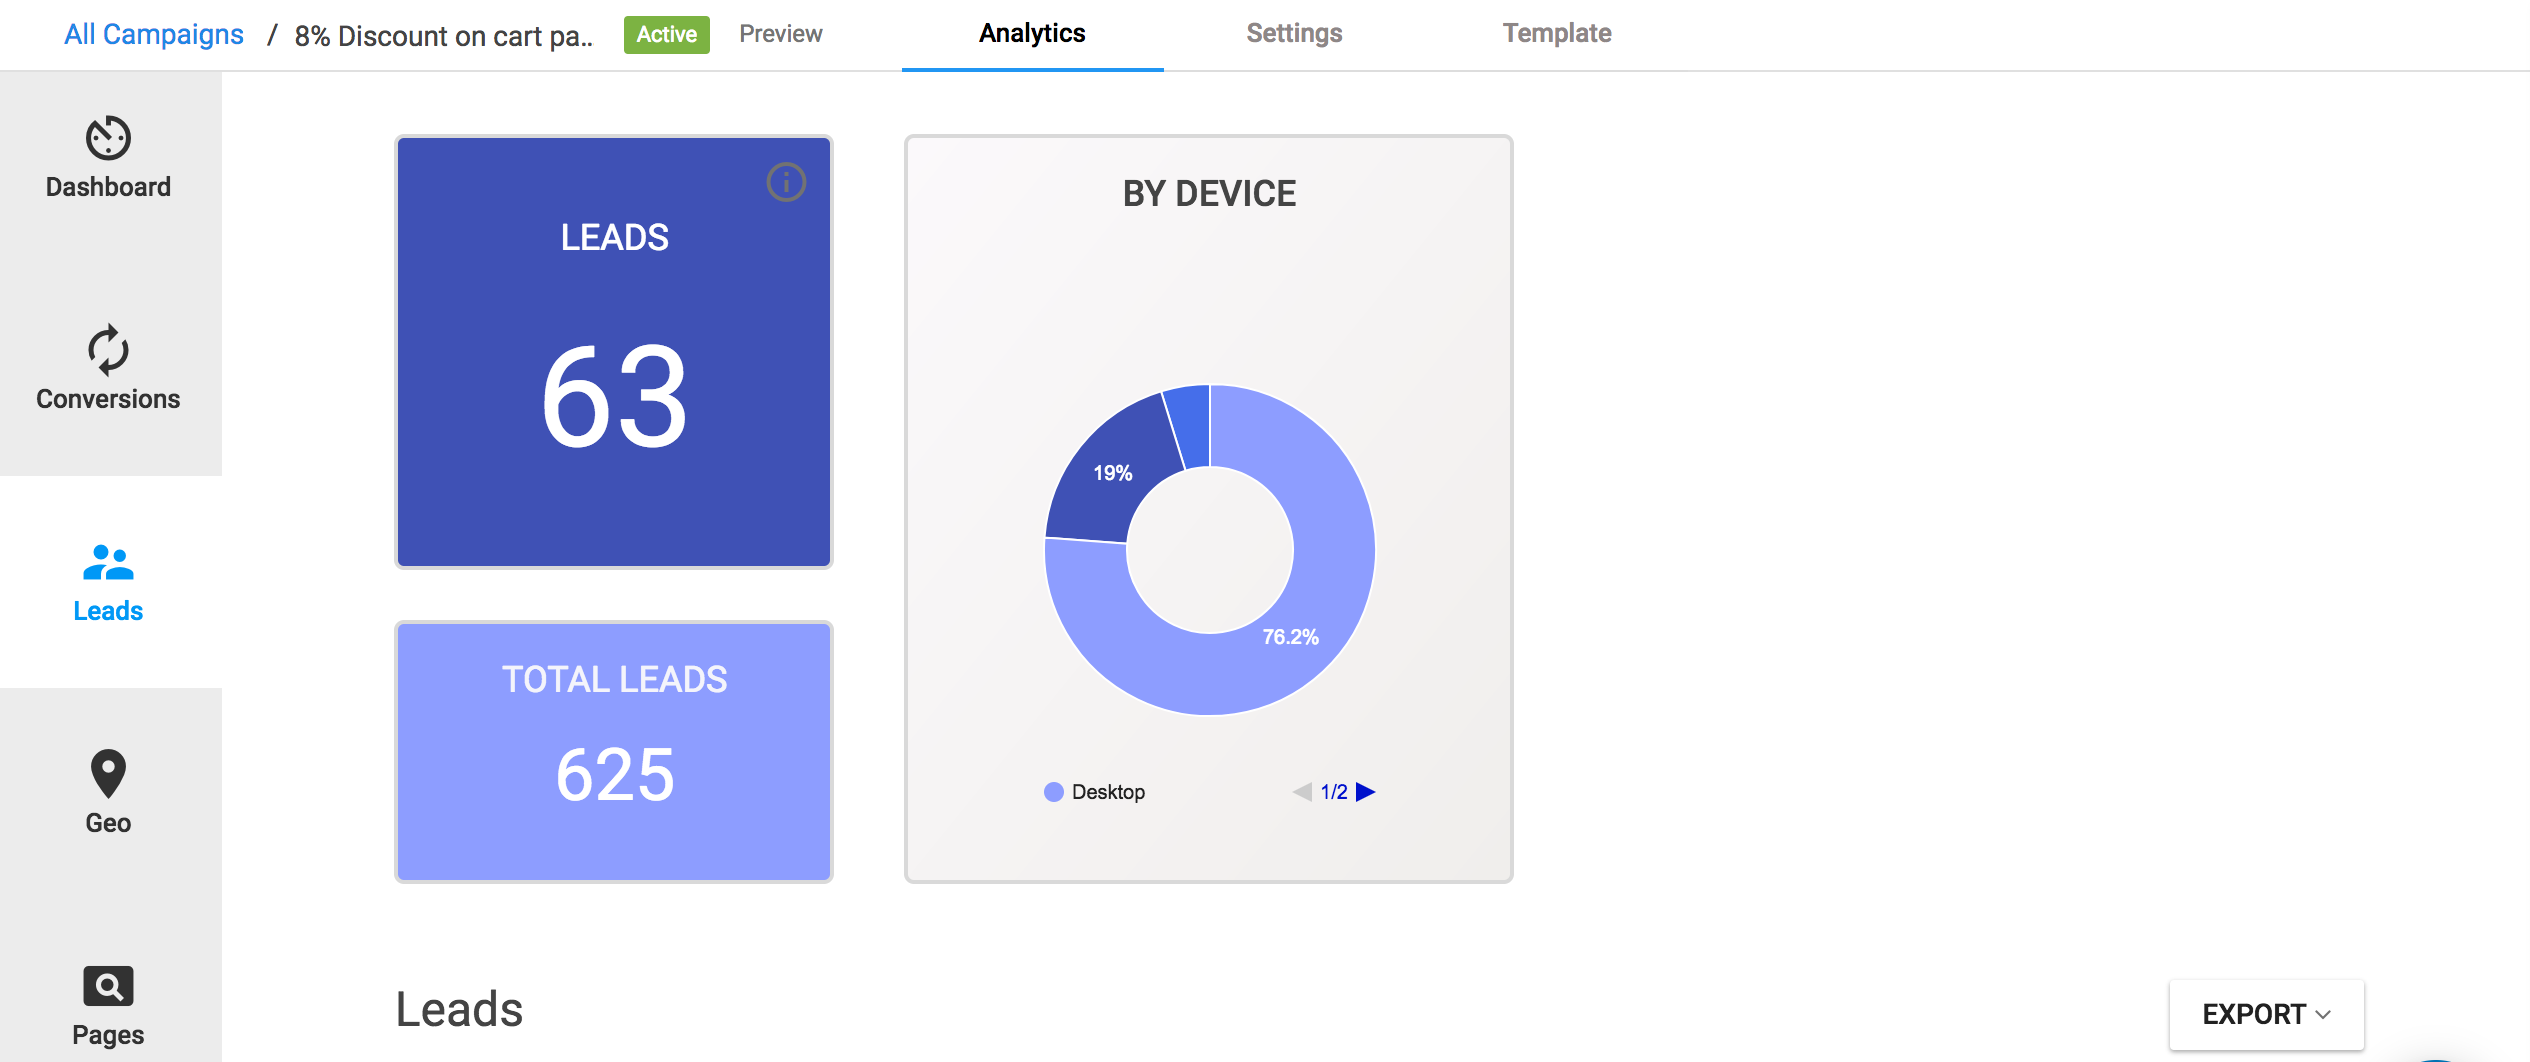
The 2 information boxes present:
- the number of leads the campaign has generated in the selected date range
- the total number of leads generated since you activated the campaign for the first time
The device pie chart presents the percentage of leads per device (Desktop, Mobile and Tablets):
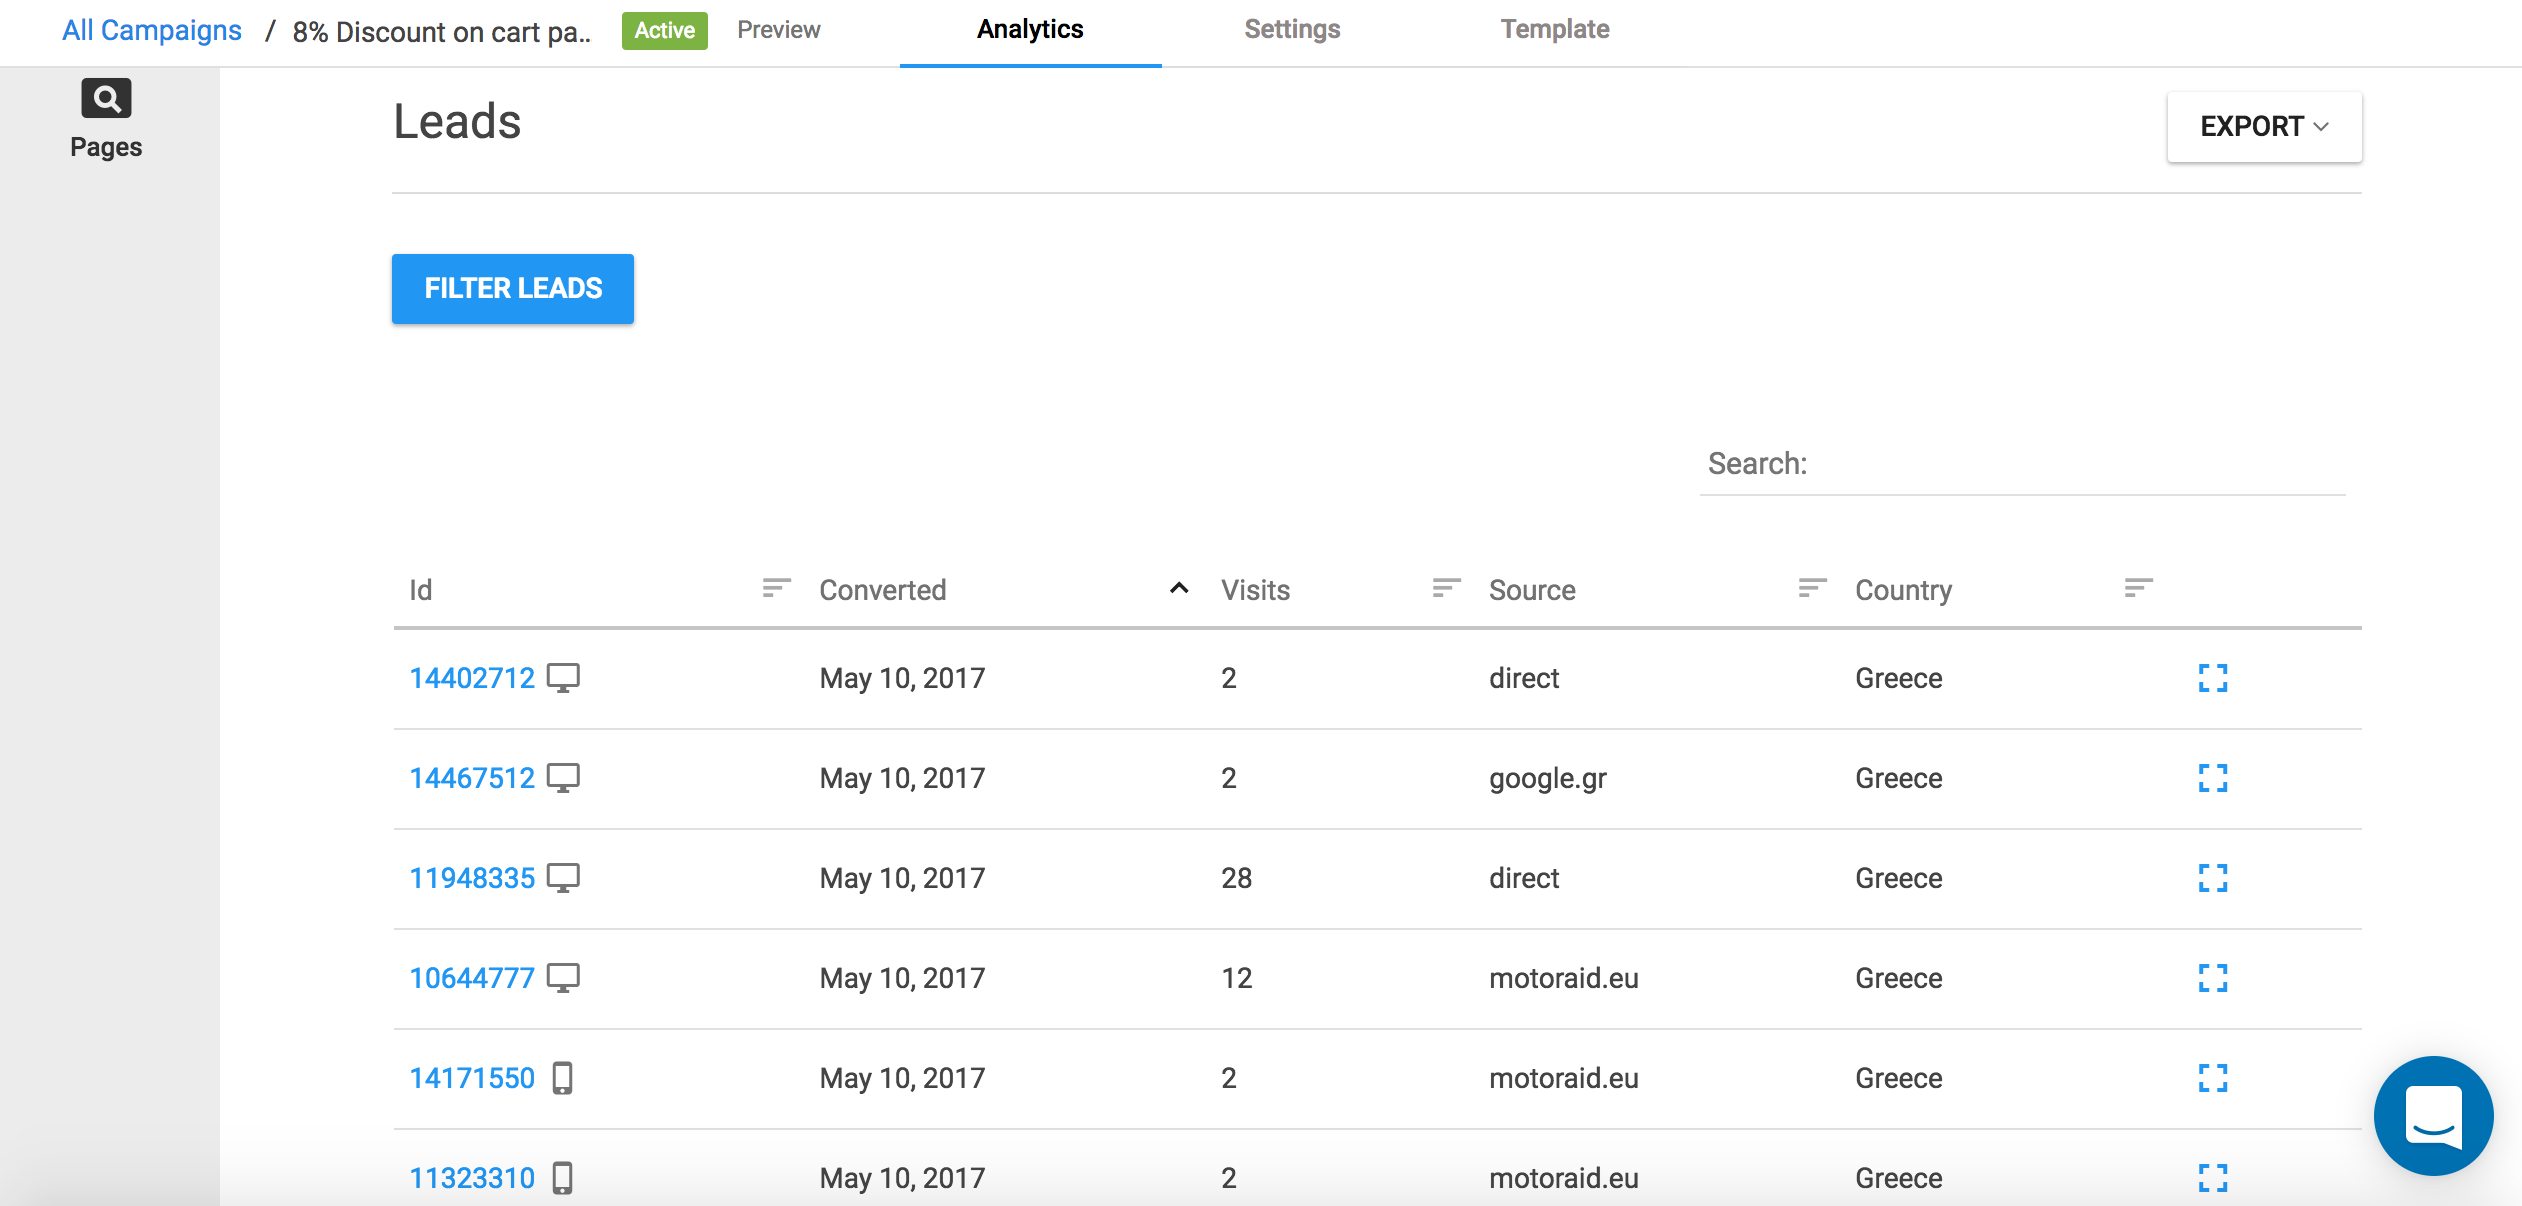
Right below this, is the list of your campaign leads. Use the "Filters" button to filter the leads list based on their device, location, page views and more.
Use the "Export" button to export your leads in an Excel or CSV document.
Want to know each of your leads more personally? Simply click on a lead to reveal more information about them on the Single Lead View.
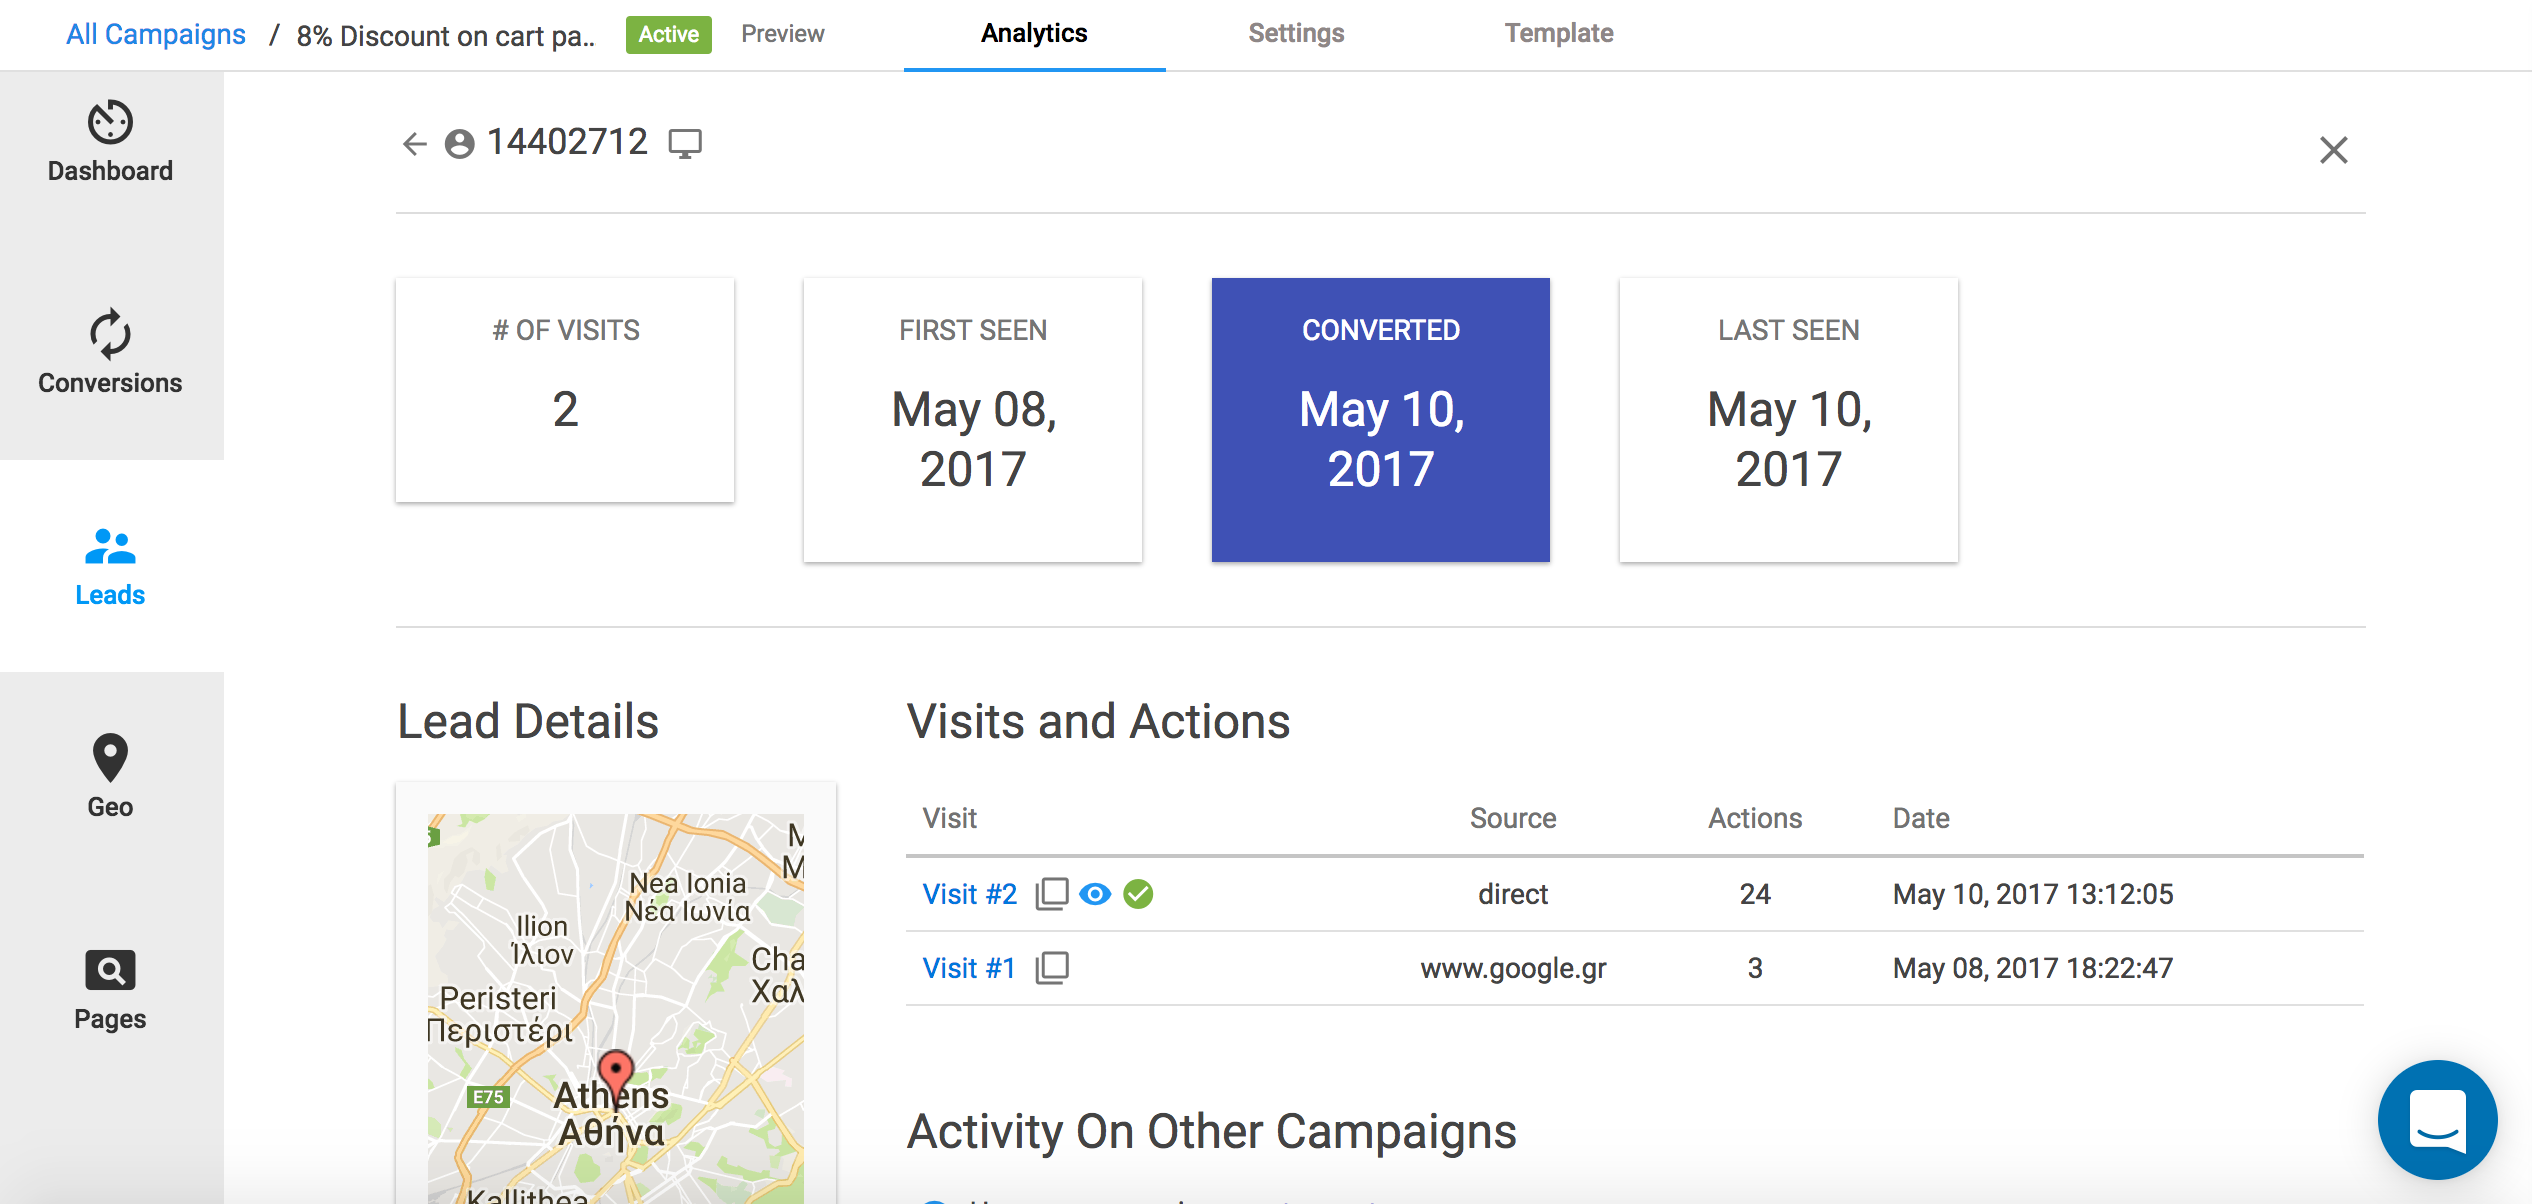
The info boxes on the top of the Single Lead View will give you insights into when the visitor first landed on your website, when he converted, when was he last seen and the pages he has visited.
The "Lead Details" section displays the lead location as well as the data gathered from your Exit Bee campaign.
If for example, you run a Lead Generation campaign where the visitors input their Name, Email and Phone number here is the place to find all this info.
The "Visits and Actions" section lists the pages this lead has visited along with any campaign actions they took, such as viewed, converted or rejected your Exit Bee campaign. Those pages are grouped per each visit on your website.
The "Activity on Other Campaigns" section lists all the actions this particular lead has taken on any of your other campaigns.
This is particularly important in order to determine a lead's behaviour in all of your campaigns. See for example that a lead that converted in most of your campaigns, reject a particular campaign - this lets you gather this lead's preferences.