
To get a grasp of the website pages your Exit Bee campaign is doing the best on, select ‘Pages’ from the left sub menu of your analytics dashboard.
After all, you do want to know what your best website asset is and how you can optimise it for even higher conversion rates.
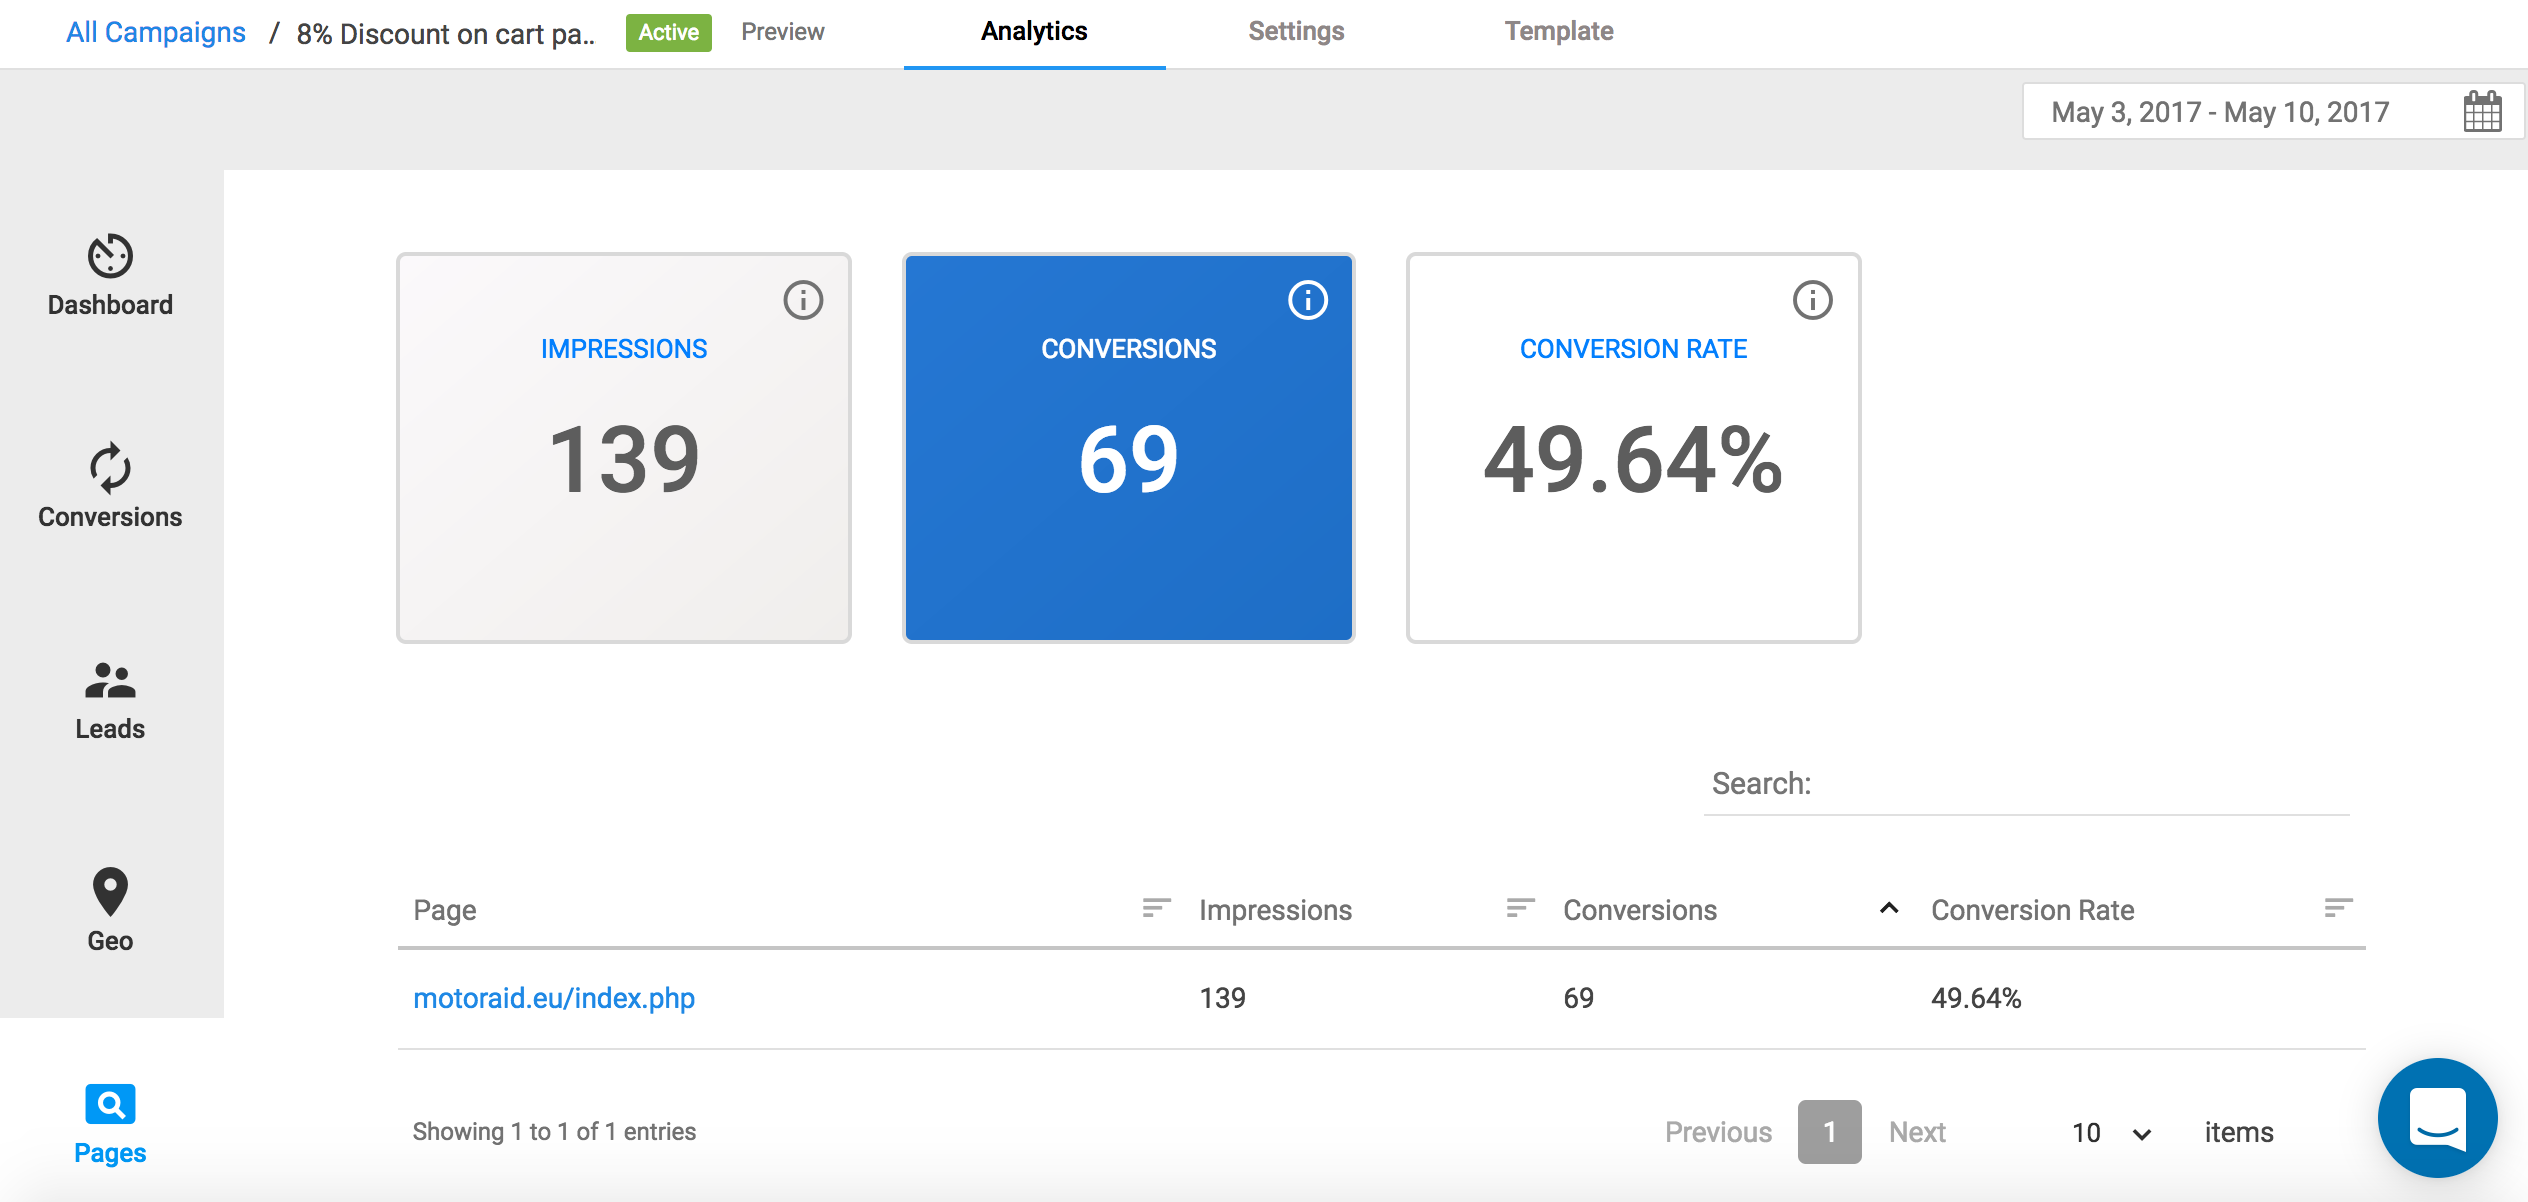
The 3 information boxes on the top of the Pages View display the following information for your selected date range from the top right range selector:
- Impressions: The total number of website visitors that have viewed your Exit Bee campaign.
- Conversions: The total number of website visitors that converted on your Exit Bee campaign. By saying converted, we mean that they took a desired action, such us give their email, followed a link, liked your Facebook page etc (depending on your campaign type).
- Conversion rate: The average number of conversions per campaign views, shown as a percentage. Conversion Rates are calculated by simply taking the total number of campaign conversions and dividing that by the number of total views your campaign had over a period of time.
Following the above, is a list of all your website pages along with the Impressions, Conversions and the Conversion Rate that was achieved on each of them.
Click on any list label to get a sorted listing by a field of your choice or use the Search above to look for particular pages in the list.