
To get an in-depth view at how your Exit Bee campaign is performing at different locations, select 'Geo' from the left sub-menu of your analytics dashboard.
Here you can get insights into the countries your website is getting traffic from and where your campaign is getting the most conversions from.
Why is this important? Because personalising based on the location of your visitors can bag you greater number of conversions and customers!
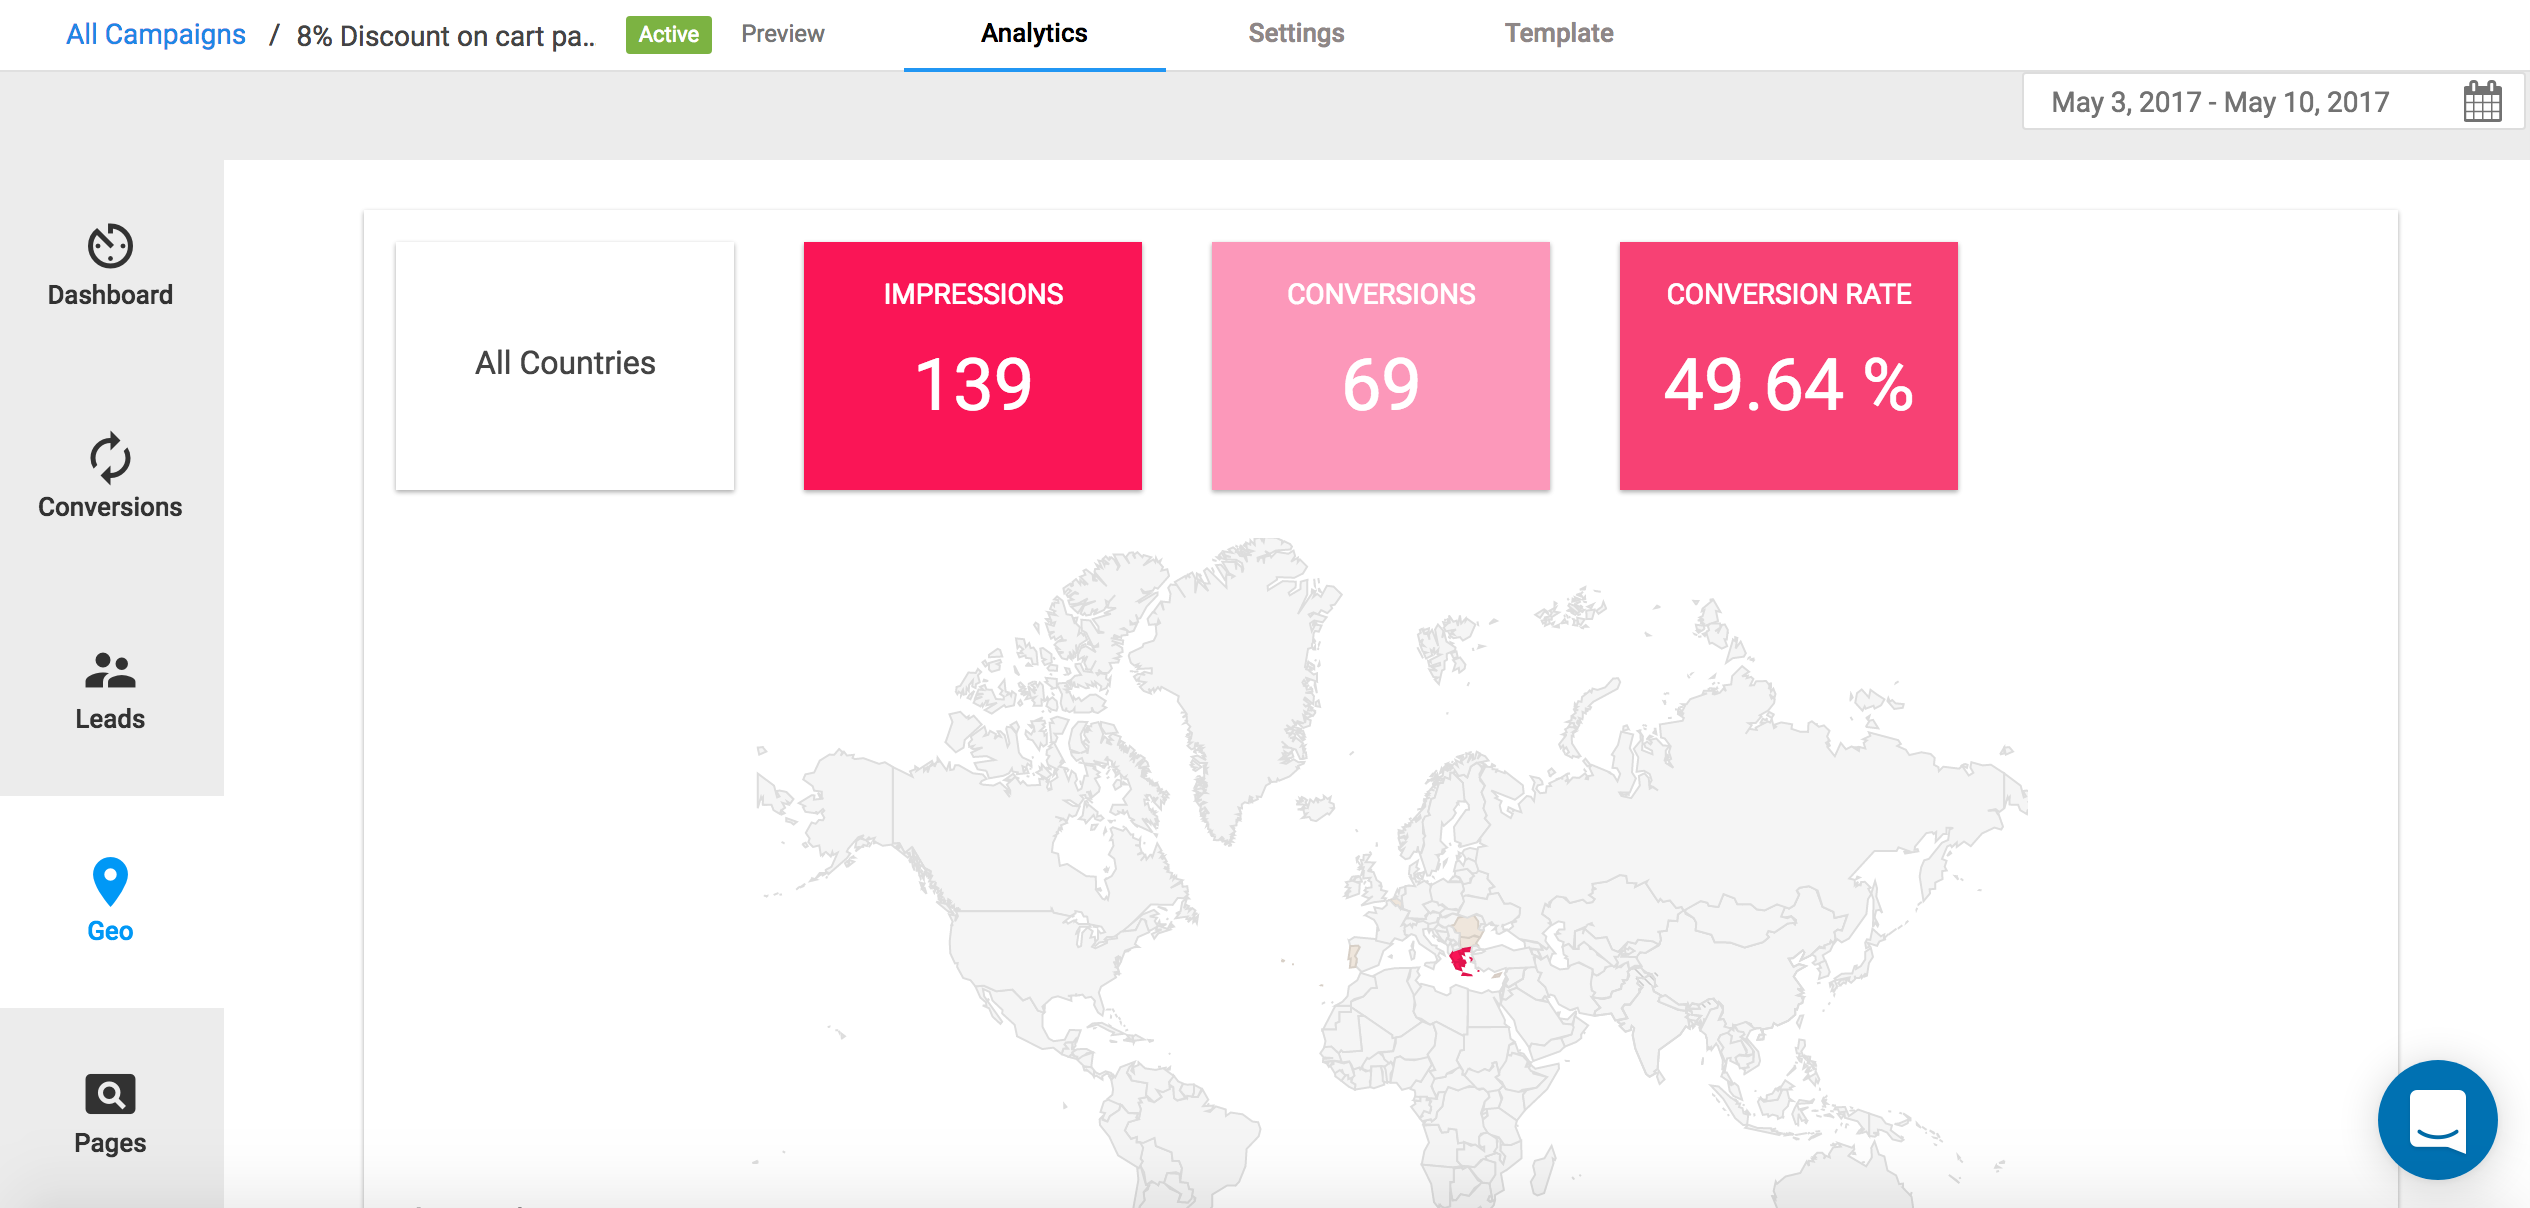
The information boxes on the top of the Geo View display the following information for your selected date range:
- Impressions: The total number of website visitors that have viewed your Exit Bee campaign.
- Conversions: The total number of website visitors that have converted on your Exit Bee campaign. By saying converted, we mean that they took a desired action, such as give their email, followed a link, liked your Facebook profile etc (depending on your campaign type).
- Conversion rate: The average number of conversions per campaign views, shown as a percentage. Conversion Rates are calculated by simply taking the total number of campaign conversions and dividing that by the total number of views on your campaign over a period of time.
Right below the above, you are presented with an interactive drill down global map containing all the countries from which your visitors came. Move your mouse over a particular country to view the total Impressions and Conversions coming from there.
By clicking on a country on the map, it drills down from a global to a country map where all the corresponding cities are displayed. Move your mouse over a particular city to view the total Impressions and conversions coming from there.
Apart from the map display, all the above information is also listed below the map on a list containing additional information about each country/city such as the Conversion Rate and the total number of visitors.
Click on any list label to get a sorted listing by a field of your choice.
