
On your analytics dashboard, you can take a deeper look into how each of your campaigns are performing on a day-to-day basis or over a defined time range.
The dashboard provides an overview on your campaign performance. You can take an in-depth look into each from the left sub-menu to get deeper insights into your campaign's analytics.
But before you do so, select the date range for which you'd like to see the analytics from the top right section as marked.
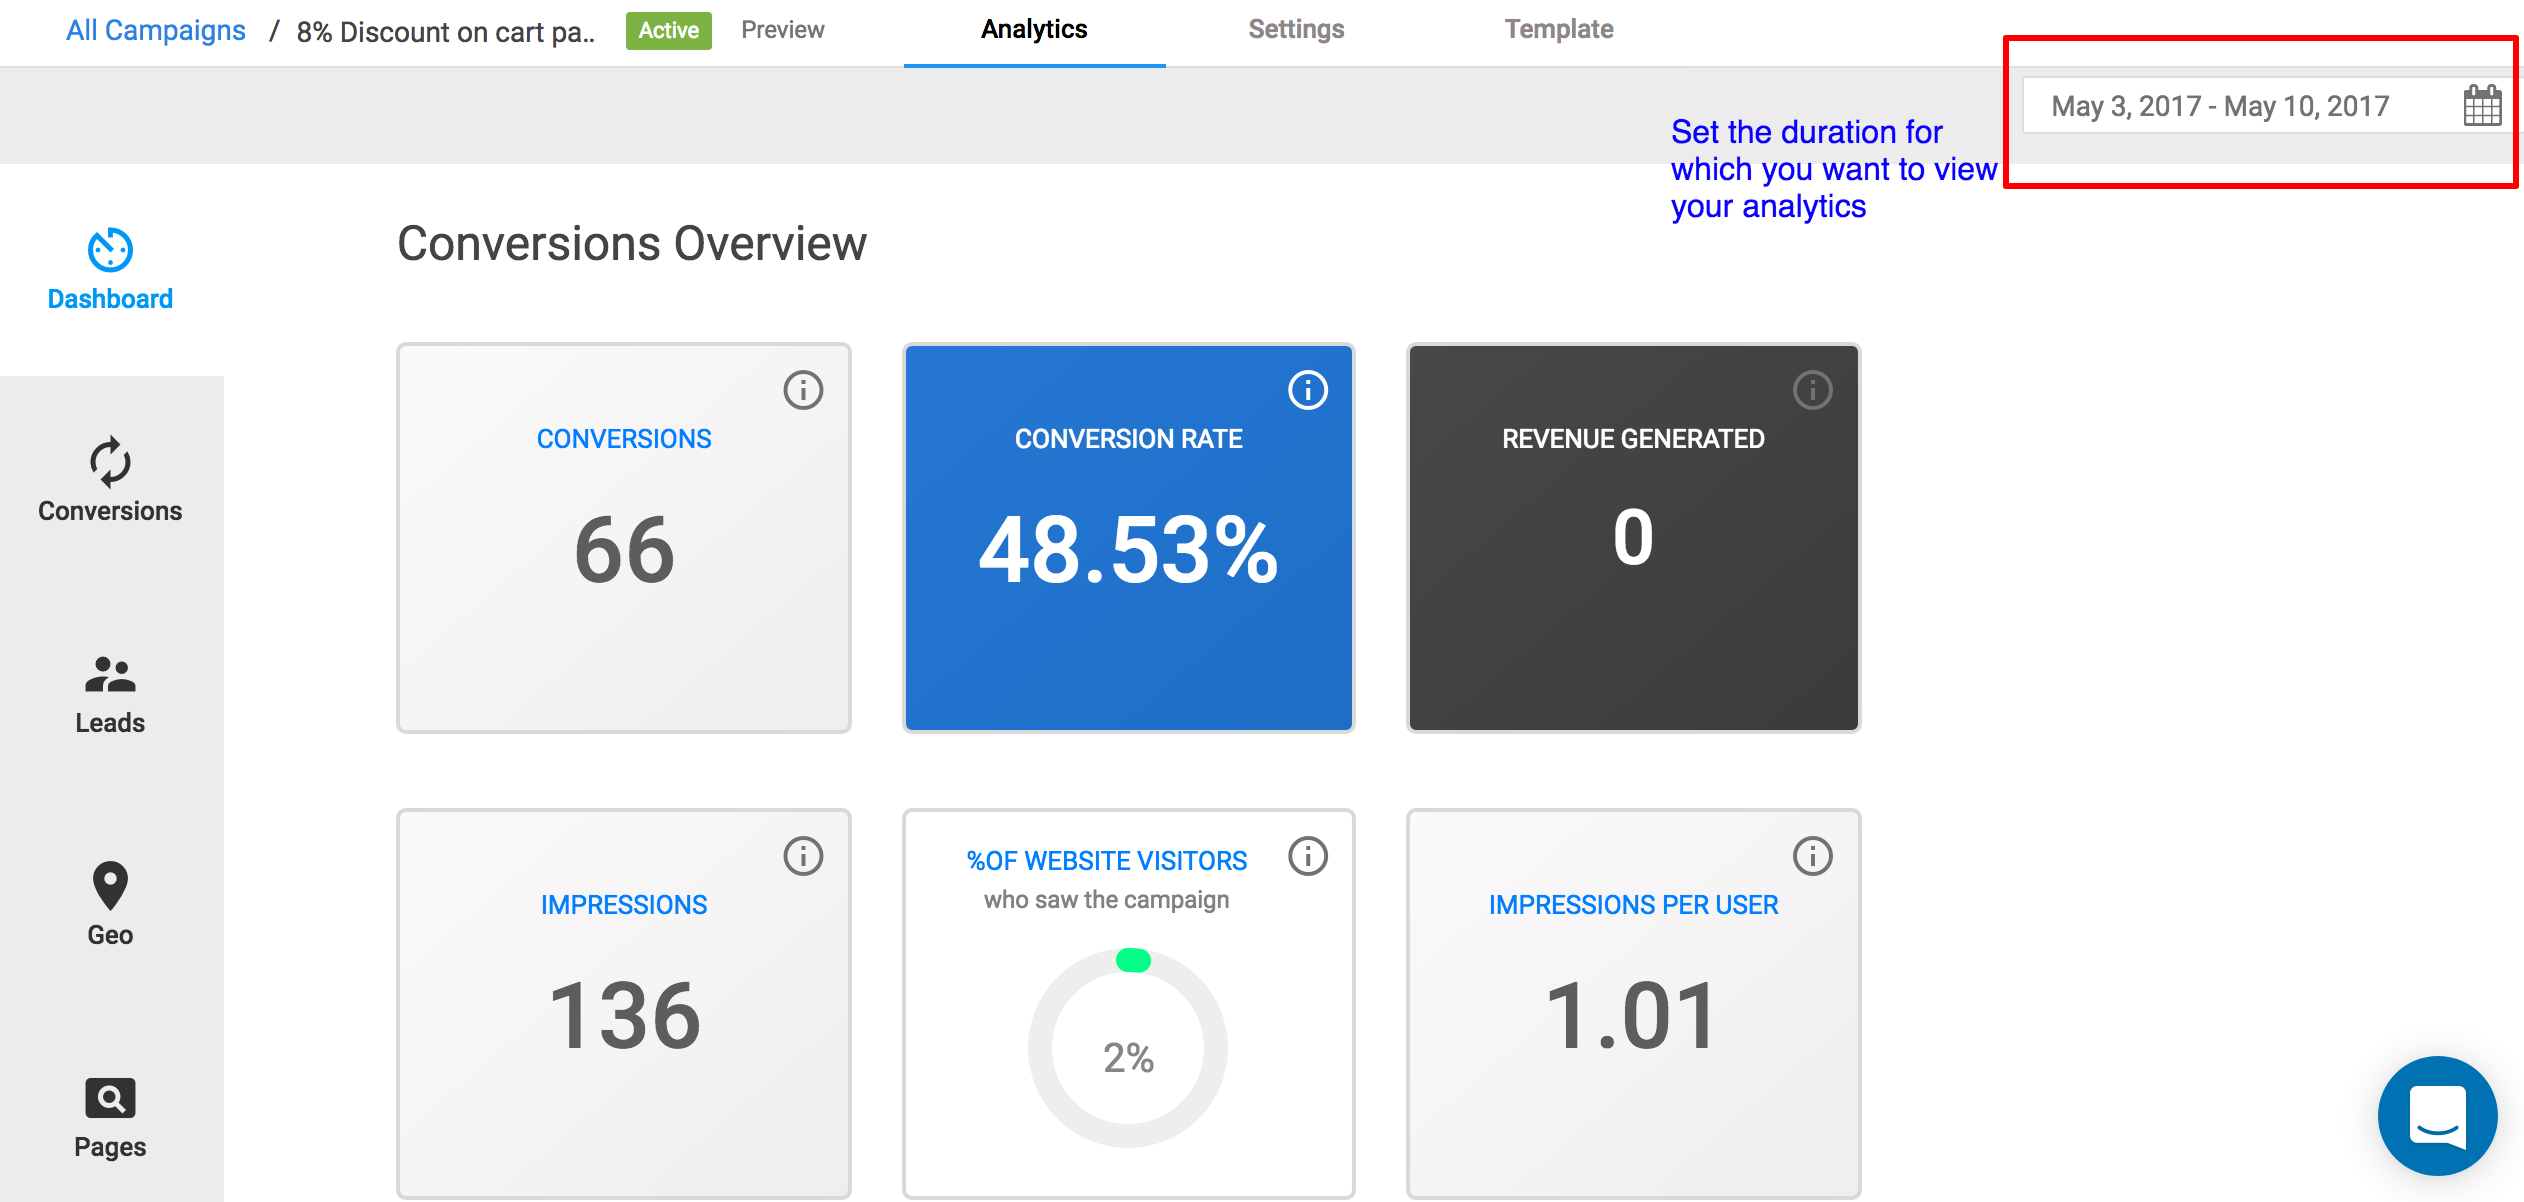
IMPORTANT: All the analytics provided on the dashboard and explained below are specifically presented for this selected date range.
Conversions Overview
The Conversions Overview section is presented as:
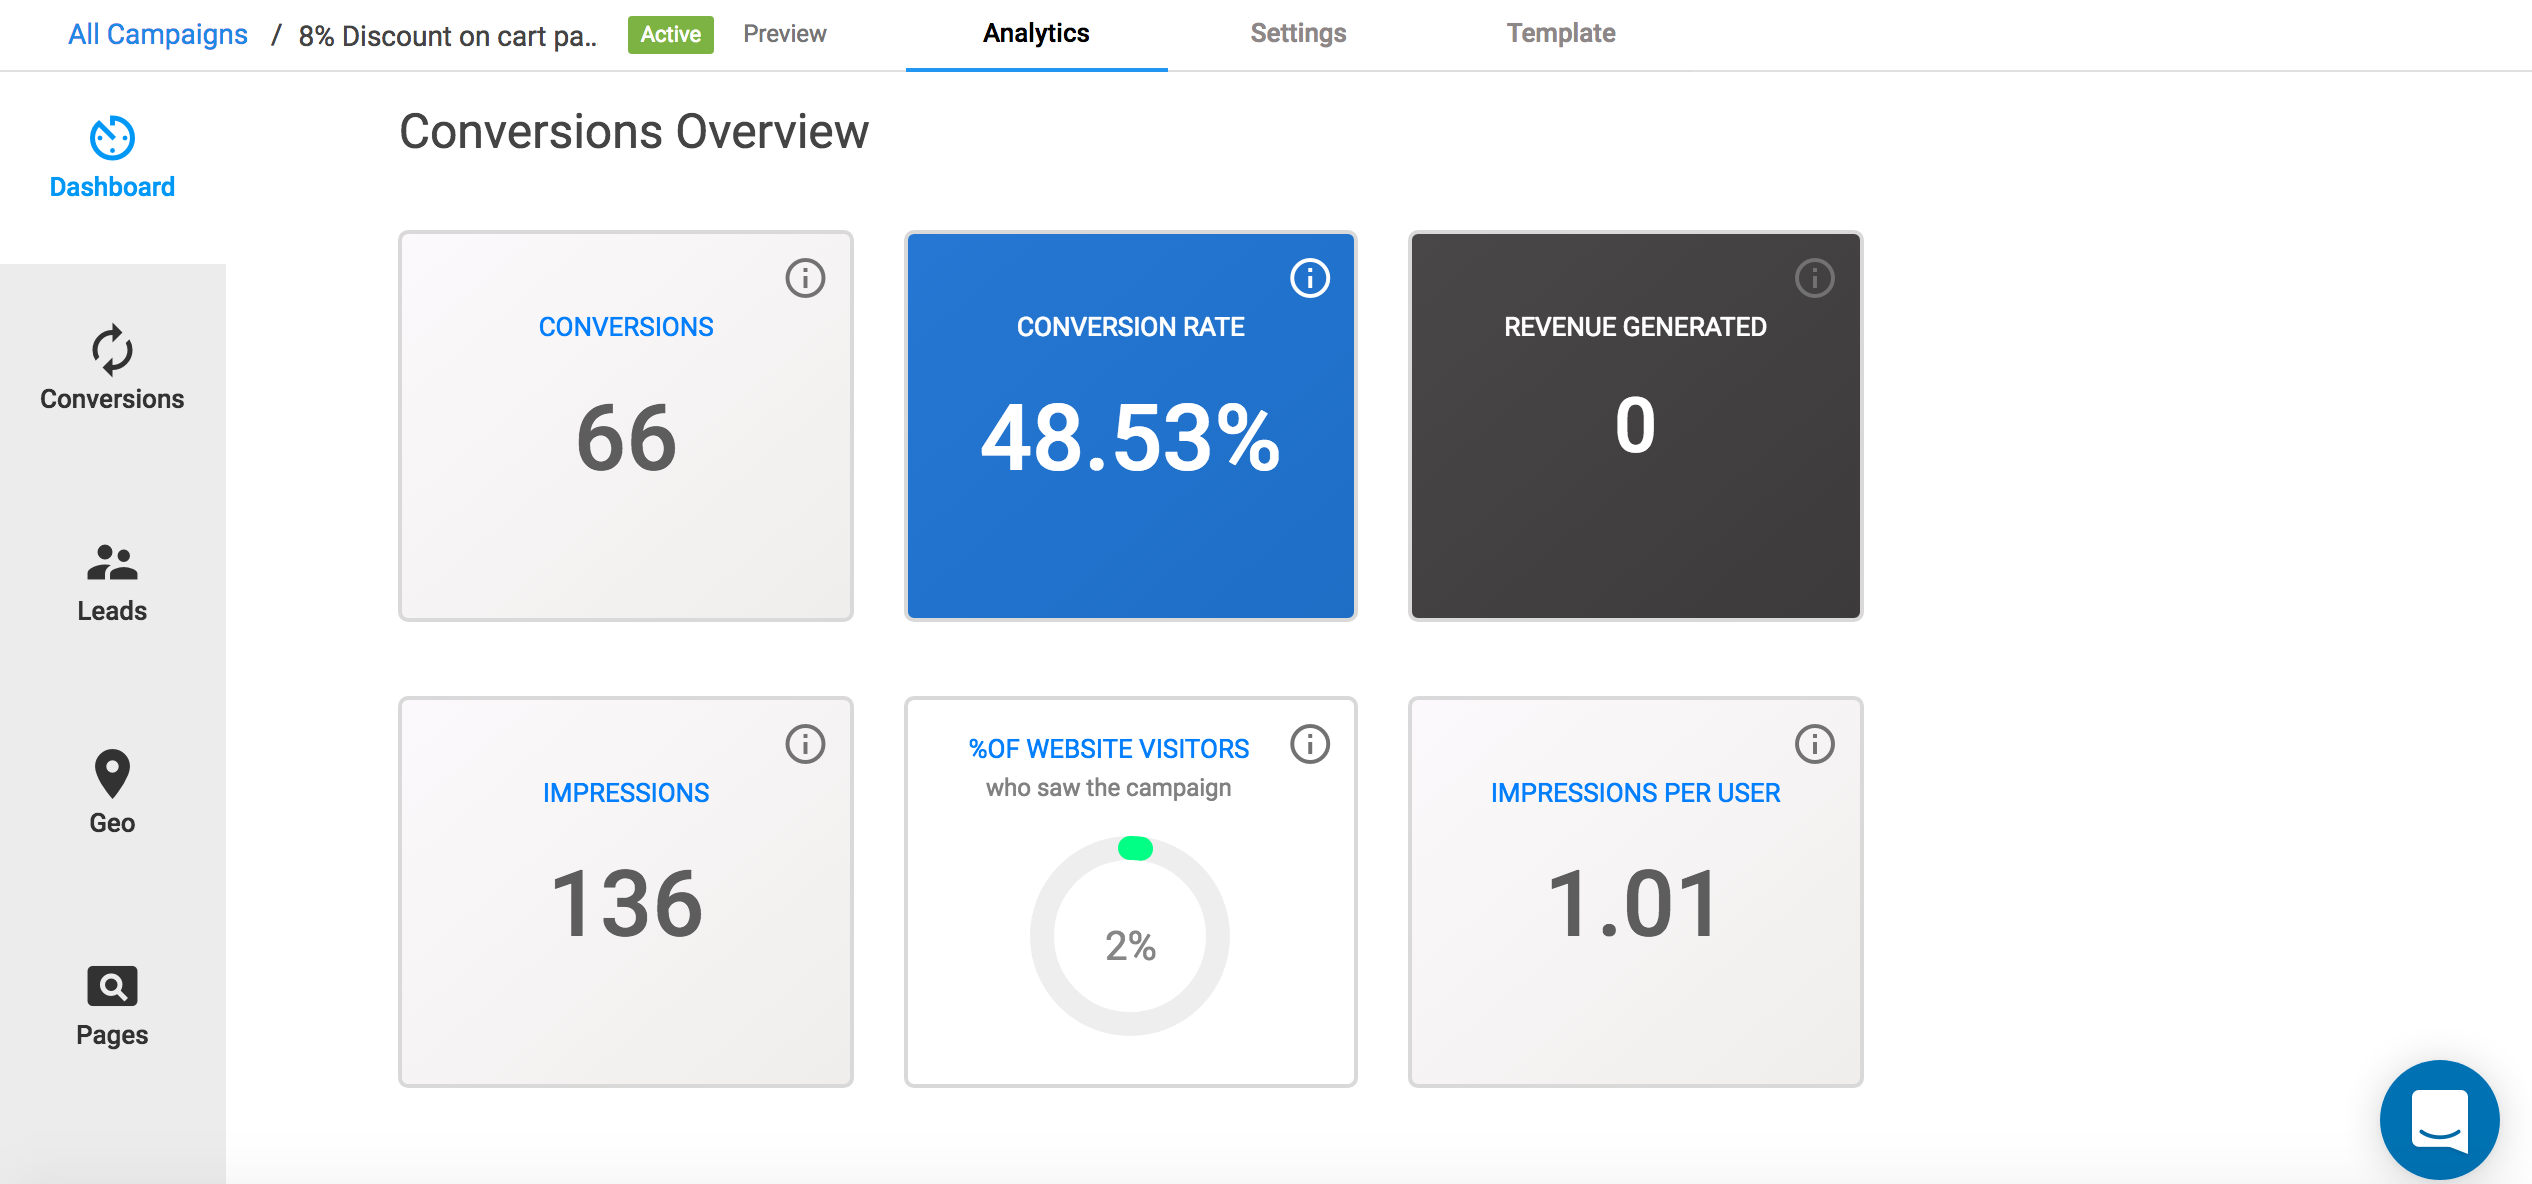
- Conversions: The total number of your website visitors that converted on your Exit Bee campaign. By saying converted, we mean that they took a desired action, such us give their email, followed a link, liked your Facebook profile etc (depending on your campaign type).
- Conversion rate: The average number of conversions per campaign views, shown as a percentage. Conversion Rates are calculated by simply taking the total number of your campaign conversions and dividing that by the total number of views on your campaign over a period of time.
- Generated Revenue (shops only): The total value of all the products that a converted visitor from your campaign has purchased. (In order to view this you will need to add the Exit Bee e-commerce code to your shop)
- Impressions: The total number of your website visitors that viewed the Exit Bee campaign.
- % of website visitors who saw the campaign: The number of website visitors who actually viewed the Exit Bee campaign divided by the total number of your website visitors, shown as a percentage.
- Impressions per user: The average number of impressions of your Exit Bee campaign per user.
Location Overview
The Location Overview section presents the following information:
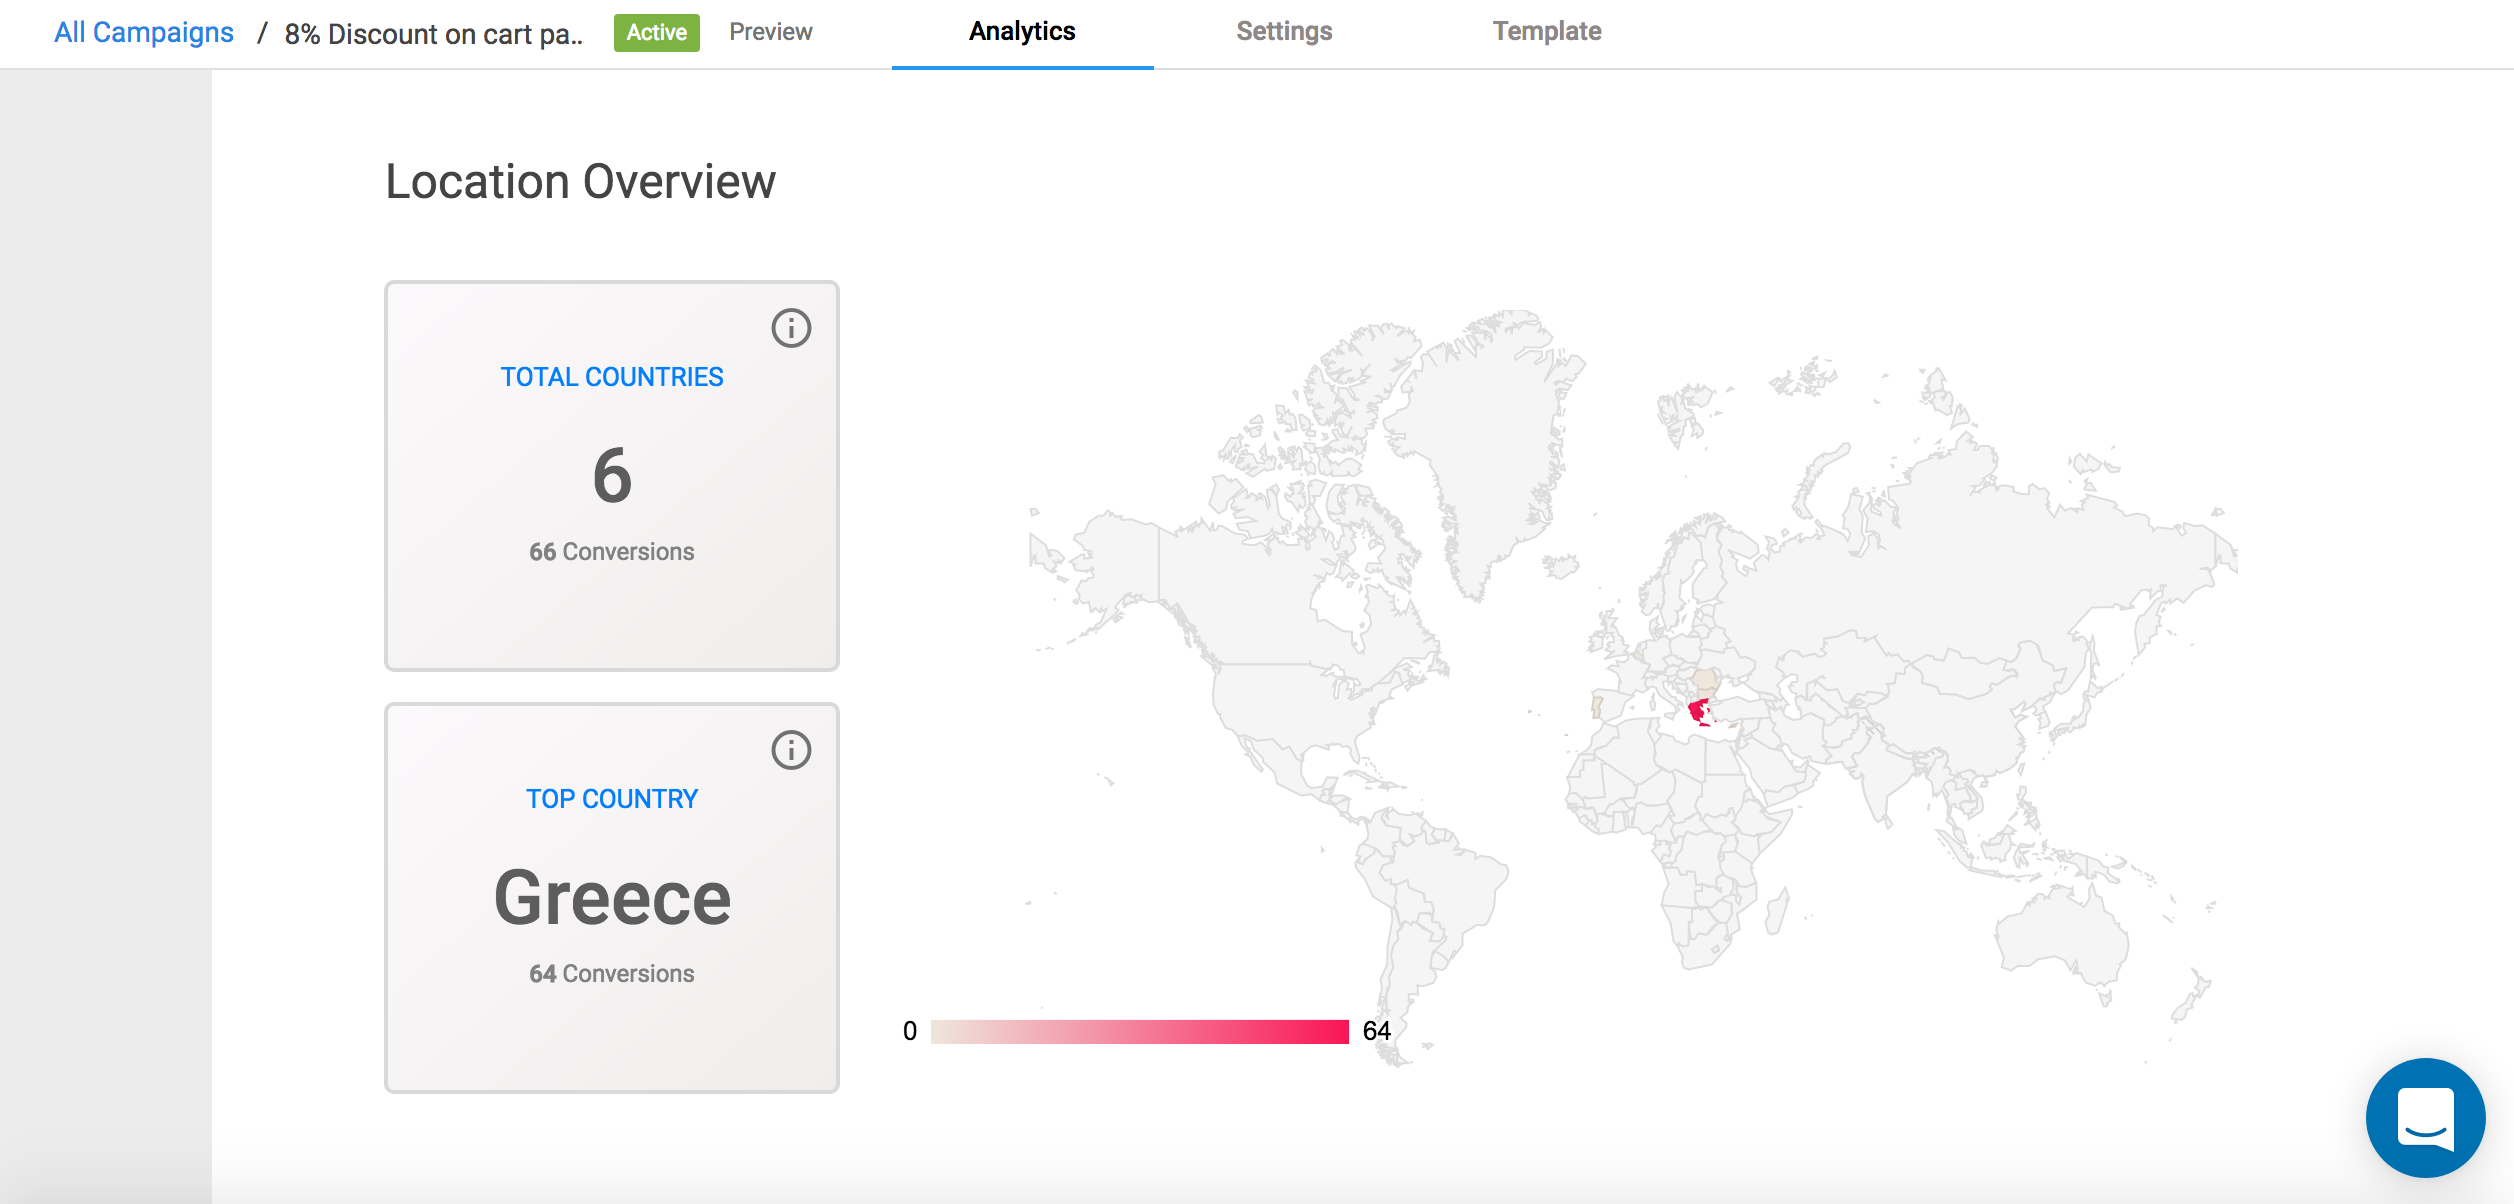
- Total Countries: The number of countries your website visitors are coming from.
- Top country: The country from which your Exit Bee campaign is getting the most conversions from.
All the information presented above, are presented in-depth in the rest of the analytics left sub-menu tabs.